Le sindromi coronariche acute includono l’infarto miocardico con elevazione ST (STEMI), l’infarto non STEMI (NSTEMI) e l’angina instabile (UA). NSTEMI è differenziato dall’angina instabile (UA) per la presenza di necrosi miocardica.
L’infarto miocardico con elevazione del tratto ST
Nei pazienti che presentano sintomi di ischemia miocardica, l’infarto miocardico con elevazione ST (STEMI) (anche detto: infarto miocardico trans-murale, infarto miocardico con onda Q, infarto) è definito dalla combinazione di un’elevazione persistente del segmento ST e dal successivo rilascio di biomarcatori della necrosi miocardica.
Altri tipi di sindromi coronariche acute includono l’infarto miocardico senza elevazione del tratto ST (NSTEMI) e l’angina instabile (UA). NSTEMI si differenzia da UA per la presenza di necrosi miocardica.
Lo STEMI è più spesso causato dalla rottura della placca di una lesione aterosclerotica nell’arteria coronarica colpita, seguita da un’occlusione totale. Selezionate cause non aterosclerotiche possono anche risultare in STEMI.
I fattori di rischio comuni includono abuso di tabacco, dislipidemie, ipertensione, diabete mellito e la storia familiare di CAD.
L’infarto miocardico da elevazione del segmento ST viene definito come:
nuova elevazione ST nel punto J in due derivazioni contigue con i seguenti valori di cut-off:
≥ 2 mm (0,2 millivolt [mV]) negli uomini o ≥ 1,5 mm (0,15 mV) nelle donne nelle derivazioni V2-V3;
≥ 1 mm (0,1 mV) in 2 altre derivazioni contigue toraciche o per arti.
nuovo o presumibilmente nuovo LBBBB, che viene considerato un equivalente di STEMI (ma la maggior parte dei casi di LBBBB al momento della diagnosi non sono noti per essere pregressi o di nuova insorgenza);
Immagine 01
Immagine 01. Electrocardiogram example of ST-segment elevation. The initial onset of the Q wave shown by arrow 1 serves as the reference point and arrow 2 shows the onset of the ST-segment or J-point. The difference between the two identifies the magnitude of displacement. Measurements of both arrows should be made from the top of the electrocardiogram line tracing.
European Society of Cardiology, American College of Cardiology, American Heart Association e World Heart Federation (ESC/ACC/AHA/WHF) 2018 hanno fornito la definizione universale dell’infarto miocardico:
criterio per la lesione del miocardio: un aumento e/o di una diminuzione dei marcatori biochimici cardiaci (preferibilmente delle troponine) con almeno un valore al di sopra del 99° percentile del limite superiore di riferimento unitamente ad evidenza di ischemia miocardica associata;
criteri per l’infarto miocardico acuto: il termine “infarto miocardico acuto” deve essere utilizzato quando vi sia evidenza di necrosi miocardica nell’ambito di un contesto clinico di ischemia miocardica. Su queste basi, ciascun criterio fra i seguenti soddisfa la diagnosi di infarto miocardico:
riscontro di un aumento e/o di una diminuzione dei marcatori biochimici cardiaci (preferibilmente delle troponine) con almeno un valore al di sopra del 99° percentile del limite superiore di riferimento unitamente ad evidenza di ischemia miocardica associata ad almeno uno dei seguenti sintomi di ischemia:
sintomi di ischemia;
variazioni elettrocardiografiche suggestive di nuova ischemia (nuove anomalie ST-T o nuovo blocco di branca sinistra);
sviluppo di onde Q patologiche su ECG;
riscontro con tecniche di imaging di una nuova perdita di miocardio vitale o di nuove alterazioni della cinesi parietale regionale;
identificazione del trombo intra-coronarico mediante angiografia o autopsia
ritrovamento post mortem di atero-trombosi acuta nell’arteria che alimenta il miocardio infartuato, indipendentemente dai valori di cTn
rilevamento di aumento e/o diminuzione dei valori cTn con ≥ 1 valore > 99° percentile del limite di riferimento superiore più:
evidenza di uno squilibrio tra l’offerta e la domanda di ossigeno miocardico non correlato all’aterotrombosi acuta più almeno 1 di:
sintomi di ischemia;
nuovi cambiamenti dell’ECG ischemico;
sviluppo di onde Q patologiche su ECG;
prove di imaging di nuova perdita di miocardio vitale o di nuova anomalia di movimento della parete regionale;
morte cardiaca improvvisa e inattesa, con arresto cardiaco, spesso accompagnata da sintomi suggestivi di ischemia miocardica, associata a verosimile nuovo sopraslivellamento del tratto ST o nuovo blocco di branca sinistra e/o riscontro angiografico e/o autoptico di recente trombosi coronarica. In ogni caso, morte verificatasi prima del prelievo di sangue o quando i livelli dei marcatori biochimici cardiaci non erano ancora rilevabili;
criteri per l’infarto miocardico correlato alla PCI che si verifica entro le 48 ore dopo la procedura:
è possibile effettuare diagnosi se si riscontra:
nei pazienti on livelli basali di cTn normali, se si verifica un aumento > 5 volte il 99° percentile del limite superiore di riferimento
in pazienti con valori elevati e stabili (con una variazione < 20%) o in diminuzione, aumento dei valori cTn > 20%;
tali 2 criteri devono essere associati alla comparsa di:
nuove onde Q patologiche o nuovo blocco di branca sinistra;
reperti alla documentazione angiografica;
di nuova occlusione del graft o dell’arteria coronaria nativa;
riscontro con tecniche di imaging di una nuova perdita di miocardio vitale.
infarto miocardico legato a trombosi stent/scaffold rilevato mediante angiografia coronarica o autopsia in un setting di ischemia miocardica e con aumento e/o diminuzione dei valori del biomarcatore cardiaco con il riscontro di uno o più valori > 99° percentile del limite superiore di riferimento;
infarto del miocardio correlato alla restenosi rilevato mediante angiografia coronarica o autopsia in un setting di ischemia miocardica e con aumento e/o diminuzione dei valori del biomarcatore cardiaco con almeno 1 valore > 99° percentile del limite superiore di riferimento;
per l’infarto del miocardio correlato all’innesto di un bypass dell’arteria coronarica i criteri per porre diagnosi sono:
in pazienti con livelli di cTn di base normali, elevazioni di biomarcatori cardiaci > a 10 volte il 99° percentile del limite di riferimento superiore indicano una necrosi miocardica peri-procedurale;
in pazienti con valori di base elevati e stabili (< 20% di variazione) o in diminuzione, aumento dei valori cTn > 20%;
più 1 di:
nuove onde Q patologiche;
risultati angiografici coerenti con le complicazioni procedurali che limitano il flusso (come la dissezione coronarica, l’occlusione dell’arteria epi-cardica principale o dell’innesto, l’occlusione del ramo laterale, l’interruzione del flusso collaterale o l’embolizzazione distale);
prove di imaging di nuova perdita di miocardio vitale o di nuova anomalia di movimento della parete regionale;
dimostrazione post mortem di trombo legato alla procedura;
criteri per l’infarto miocardico precedente o silenzioso/non riconosciuto – qualsiasi tra i seguenti criteri:
comparsa di nuove onde Q patologiche in presenza o assenza di sintomatologia;
evidenza all’imaging di un’area assottigliata e disfunzionante di miocardio non vitale in assenza di cause di origine non ischemica;
riscontro patologico di infarto miocardico in via di cicatrizzazione o stabilizzato
Tipi
esistono 5 tipi di infarto miocardico secondo l’European Society of Cardiology, American College of Cardiology Foundation, American Heart Association e World Heart Federation (ESC/ACCF/AHA/WHF) del 2018:
Tipo 1 – infarto miocardico spontaneo correlato all’ischemia dovuta ad un evento coronarico primario, come nel caso di erosione e/o rottura, fissurazione o dissezione della placca.
Tipo 2 – Infarto miocardico secondario ad ischemia dovuta ad uno squilibrio tra richiesta ed offerta di ossigeno, come nel caso di spasmo coronarico, embolizzazione coronarica, anemia, aritmie, ipertensione o ipotensione.
Tipo 3 – Morte cardiaca improvvisa e inattesa, con arresto cardiaco, spesso accompagnata da sintomi suggestivi di ischemia miocardica, verosimilmente associata a nuovo sopraslivellamento del tratto ST, o nuovo blocco di branca sinistra o riscontro angiografico e/o autoptico di recente trombosi coronarica. In ogni caso, morte verificatasi prima del prelievo di sangue o quando i livelli dei marcatori biochimici cardiaci non erano ancora rilevabili.
Tipo 4 – infarto del miocardio associato ad intervento coronarico percutaneo (Tipo 4a) o associato a riscontro angiografico o autoptico di trombosi dello stent (Tipo 4b).
Tipo 5 – infarto del miocardio correlato ad intervento di bypass aortocoronarico.
L’infarto del miocardio senza aterosclerosi ostruttiva delle coronarie (MINOCA):
si riferisce all’infarto miocardico acuto con dimostrazione di arterie coronariche non ostruite.
secondo i criteri diagnostici della Società Europea di Cardiologia (ESC), la diagnosi di MINOCA viene effettuata immediatamente dopo l’angiografia coronarica in pazienti che presentano caratteristiche coerenti con l’infarto miocardico acuto e richiede il rispetto di 3 criteri diagnostici:
Criteri AMI:
biomarcatore cardiaco positivo (preferibilmente troponina cardiaca) definito come aumento e/o caduta dei livelli seriali con il riscontro di almeno un valore > 99° percentile limite superiore di riferimento;
evidenza clinica coerente all’infarto evidenziata da almeno uno dei seguenti elementi:
sintomi di ischemia;
nuove, o presunte nuove, significative modifiche ST-T o nuovo blocco di ramo sinistro (LBBB) ;
sviluppo di onde Q patologiche;
prove di imaging di nuova perdita di miocardio vitale o di nuova anomalia di movimento della parete regionale;
prove di trombo intra-coronarico su angiografia coronarica o autopsia;
arterie coronariche non ostruite secondo i criteri dell’angiografia coronarica:
definita come assenza di CAD ostruttiva sull’angiografia (assenza di stenosi coronarica ≥ 50%) in qualsiasi potenziale arteria correlata all’infarto, che può includere:
ateromatosi coronarica lieve (stenosi > 30% ma < 50%);
nessuna causa specifica clinicamente evidente per i criteri di presentazione acuta:
durante la coronarografia non è possibile riscontrare una specifica causa e specifica diagnosi per la presentazione clinica;
necessità di ulteriormente indagini per sottolineare la causa alla base della presentazione del MINOCA.
Immagine 02
Immagine 02. Infarto miocardico di tipo 1
Immagine 03
Immagine 03. Infarto miocardico di tipo 2.
Epidemiologia
La malattia coronarica acuta colpisce più frequentemente:
adulti con malattia coronarica;
uomini (circa il 70% dei pazienti);
inoltre, è stato segnalato che l’infarto miocardico acuto in età più giovane compare:
più spesso in uomini rispetto alle donne;
persone con uno status socio-economico basso;
pazienti neri e ispanici rispetto ai pazienti bianchi;
paesi dell’Asia meridionale rispetto ad altri paesi.
Eziologia e patogenesi
la placca aterosclerotica dovuta a malattia coronarica può rompersi con conseguente occlusione dell’arteria coronarica (la causa più comune dello STEMI);
meno comunemente, l’erosione della placca con endotelio danneggiato o assente può causare ostruzioni coronariche attraverso lo sviluppo di un trombo su intima disfunzionale;
Le cause non aterosclerotiche includono:
emboli:
trombi a partenza dal ventricolo sinistro (cardiomiopatia), atrio sinistro (fibrillazione atriale, stenosi mitralica), valvole protesiche, cateteri durante l’angiografia;
embolia di aria (angiografia coronarica, bypass cardiopolmonare);
endocardite infettiva, endocardite trombotica non batterica (NBTE);
mixoma atriale.
ostruzione meccanica:
trauma toracico (contusione, lacerazione);
aneurisma aortico toracico e dissezione;
dissezione delle arterie coronariche (post-partum, intervento coronarico percutaneo (PCI), angiografia post coronarica);
displasia fibromuscolare;
aumento del tono vasomotorio (angina variante o di Prinzmetal, sospensione della terapia con nitroglicerina);
infarto del miocardio con elevazione ST probabilmente dovuto ad una grave anemia;
Patogenesi
meccanismi che possono portare alla STEMI:
più comunemente, la rottura della placca aterosclerotica con conseguente occlusione dell’arteria coronarica:
la progressione dell’aterosclerosi per espansione del nucleo lipidico e l’accumulo di macrofagi al bordo della placca provoca la rottura;
La dimensione dell’infarto dipende da:
livello di occlusione
presenza di un adeguato circolo collaterale;
durata dell’occlusione totale del vaso;
erosione superficiale (non vulnerabile) della placca;
meccanismi fisiopatologici (compreso il ruolo delle piastrine) alla base della rottura spontanea o dell’erosione della placca aterosclerotica includono:
l’instabilità della placca può essere aumentata dall’infiammazione della parete arteriosa;
l’erosione o la rottura della placca porta all’esposizione del collagene sub-endoteliale e alla successiva adesione delle piastrine;
L’adesione delle piastrine porta a cambiamenti nella forma delle piastrine e nell’attivazione delle piastrine;
agonisti piastrinici come l’adenosina di-fosfato (ADP), trombossano, e l’epinefrina producono un cambiamento conformazionale nel recettore della glicoproteina IIb/IIIa sulla superficie piastrinica che poi lega il fibrinogeno e successivamente causa l’aggregazione piastrinica e la formazione di “tappo piastrinico”.
la necrosi miocardica distale può anche risultare dalla micro-embolizzazione a valle dei detriti di placca e degli aggregati piastrinici;
la cascata della coagulazione è attivata dall’esposizione del fattore tissutale (TF):
la combinazione con il fattore V porta all’attivazione del fattore di coagulazione da X a Xa;
il fattore Xa porta all’attivazione del fattore di coagulazione II (protrombina) al fattore IIa (trombina);
la trombina converte il fibrinogeno in fibrina, intrappolando gli aggregati piastrinici e provocando la formazione di trombi;
vasospasmo coronarico dovuto a:
disfunzione endoteliale focale (ad esempio, l’angina di Prinzmetal);
effetti della droga da:
cocaina;
agenti chemioterapici;
agonisti del recettore della serotonina;
squilibrio tra l’offerta e/o la domanda di ossigeno miocardico;
la diminuzione del flusso sanguigno miocardico può causare la necrosi miocitaria dopo diverse ore, tale necrosi può essere ritardata:
dalla presenza di circolazione collaterale verso la zona ischemica;
dall’occlusione coronarica intermittente;
dal precondizionamento cardiaco;
L’ischemia con STEMI comporta interessamento dell’intero spessore del miocardio (ischemia trasmurale);
La necrosi miocitaria comporta la sostituzione dei cardiomiociti con tessuto cicatriziale fibroso non contrattile e il rimodellamento del miocardio:
le aree infartuate subiscono un diradamento mentre il miocardio non colpito subisce l’ipertrofia;
La mancata normalizzazione della sollecitazione della parete comporta:
dilatazione ventricolare progressiva e forma più sferica del cuore;
aumento dei peptidi natriuretici;
l’aumento dei peptidi natriuretici può provocare vasodilatazione e diuresi;
le modifiche strutturali del miocardio provocano cambiamenti elettrici nei modelli di eccitazione e conduzione;
il rimodellamento del miocardio e la disfunzione ischemica a seguito dell’infarto miocardico possono portare a varie complicazioni.
Sintomatologia
lo STEMI determina solitamente:
dolore o sensazione di costrizione al petto di solito nella regione sub-sternale (meno spesso nella regione epigastrica) con possibile irradiazione al collo, alla mascella, alla schiena, alla spalla sinistra o al braccio sinistro;
il dolore:
dura di solito ≥ 20 minuti;
si verifica con sforzo o a riposo;
non cambia con la posizione o il movimento;
viene descritto come costrittivo, senso di schiacciamento, senso di pesantezza o pressione a riposo, morsa o peso;
i pazienti possono presentare sintomi diversi dal dolore toracico, tra cui:
dispnea (più comune);
nausea e vomito;
diaforesi;
fatica inspiegabile;
palpitazioni;
sincope (rara);
debolezza;
caratteristiche NON tipicamente legate all’ischemia miocardica:
dolore pleuritico;
dolore acuto o lancinante;
dolore localizzato con la punta di 1 dito;
Esame Obbiettivo
i segni vitali sono spesso irrilevanti ma è possibile riscontrare ipertensione o ipotensione e bradicardia o tachicardia;
durante l’esame obiettivo è utile cercare segni di scompenso cardiaco e/o shock cardiogeno:
i segni coerenti con la disfunzione ventricolare sinistra o lo shock cardiogeno possono includere tachicardia e ipotensione;
è comune riscontrare bradicardia nelle prime ore di STEMI:
a causa dell’aumento del tono vagale;
associato all’infarto del miocardio inferiore;
di solito auto-limitata;
la cute può essere sudata;
la pelle fredda o il pallore suggeriscono un’ampia area di ischemia o di shock cardiogeno imminente;
la distensione venosa giugulare può verificarsi in pazienti con insufficienza ventricolare;
Cardiaco
è possibile riscontrare il tono S3 o S4;
il riscontro di un nuovo mormorio sistolico suggerisce rigurgito mitralico o rottura del setto ventricolare;
il murmure coerente con il rigurgito aortico suggerisce una possibile dissezione aortica;
il riscontro di sfregamenti pleurici suggerisce Pericardite acuta;
per derivazioni contigu si intendono gruppi contigui: derivazioni antero-laterali (V1-V6), inferiori (II, III, aVF) o laterali alte (I, aVL).
nuova elevazione ST nel punto J in due derivazioni contigue con i seguenti valori di cut-off:
≥ 2 mm (0,2 millivolt [mV]) negli uomini o ≥ 1,5 mm (0,15 mV) nelle donne nelle derivazioni V2-V3;
≥ 1 mm (0,1 mV) in 2 altre derivazioni contigue toraciche o per arti.
nuovo o presumibilmente nuovo LBBBB, che viene considerato un equivalente di STEMI (ma la maggior parte dei casi di LBBBB al momento della diagnosi non sono noti per essere pregressi o di nuova insorgenza); i criteri ECG per la diagnosi di STEMI in uno snenario di LBBB includono uno qualsiasi fra i seguenti:
sopraslivellamento ST ≥ 1 mm (0,1 mV) e concorde al complesso QRS;
depressione ST ≥ 1 mm (0,1 mV) in V1, V2 o V3;
sopraslivellamento ST ≥ 5 mm (0,5 mV) e discordante con il complesso QRS;
La depressione ST in 2 o più derivazioni precordiali (V1-V4) può indicare una lesione transmurale posteriore; ulteriori derivazioni toraciche posteriori (V7-V9) con elevazione ST > 0,5 mm (0,05 mV) (o > 1 mm [0,1 mV] negli uomini < 40 anni) sono coerenti con l’infarto miocardico posteriore;
l’ecocardiografia transtoracica può mostrare focali anomalie della parete in pazienti con risultati equivoci dell’ECG
la troponina cardiaca è il biomarcatore di scelta per la diagnosi di infarto miocardico;
l’angiografia invasiva può confermare la diagnosi se permangono dubbi clinici;
Panoramica dei test
Elettrocardiogramma a 12 derivazioni (ECG):
l’ECG a 12 derivazioni deve essere effettuato il più presto possibile subito al primo contatto con il paziente (ACC/AHA Classe I, Livello B) ed entro ≤ 10 minuti (ESC Classe I, Livello B);
il monitoraggio ECG deve essere iniziato il prima possibile (ESC Classe I, Livello B);
bisogna prendere in considerazione ulteriori derivazioni aggiuntive della parete toracica posteriore (V7-V9) in pazienti con elevato sospetto di infarto miocardico posteriore (classe IIa dell’ESC, livello C);
considerare l’uso di ulteriori elettrocateteri precordiali destri (V3R e V4R) in pazienti con infarto miocardico inferiore per identificare l’infarto concomitante del ventricolo destro (ESC Classe IIa, Livello B).
l’angiografia d’emergenza è la modalità di scelta in caso di dubbio clinico sulla possibilità di un infarto miocardico acuto in evoluzione;
la troponina T o la troponina I raccomandata per la diagnosi iniziale, ma il trattamento di riperfusione non dovrebbe essere ritardato in attesa dei risultati (classe I ESC, livello C);
gli studi di imaging (ecocardiografia, radiografia del torace) possono aiutare nella diagnosi in casi incerti ma non dovrebbero ritardare il trasferimento per l’angiografia (ESC Classe IIb, Livello C);
misurare il glucosio nel sangue al momento della valutazione iniziale in tutti i pazienti e ripetere la misurazione se sono presenti diabete o iperglicemia noti (classe I ESC, livello C);
test di laboratorio aggiuntivi per guidare la gestione e identificare le comorbilità:
conta ematica completa con conta piastrinica;
tempo di protrombina con INR;
tempo di tromboplastina parziale attivata (aPTT) ;
elettroliti;
azoto ureico del sangue (BUN), creatinina;
magnesio;
Elettrocardiografia (ECG)
Raccomandazioni della Società Europea di Cardiologia (ESC) per la diagnosi dello STEMI:
eseguire l’ECG a 12 derivazioni il più presto possibile al primo contatto con il paziente, con ritardo target ≤ 10 minuti (ESC Classe I, Livello B);
avviare il monitoraggio ECG con capacità di defibrillatore il prima possibile in tutti i pazienti con sospetto di STEMI (ESC Classe I, Livello B);
prendere in considerazione ulteriori derivazioni aggiuntive della parete toracica posteriore (V7-V9) in pazienti con elevato sospetto di infarto miocardico posteriore (occlusione dell’arteria circonflessa) (ESC Classe IIa, Livello B)
nuova elevazione ST nel punto J in due derivazioni contigue con i seguenti valori di cut-off:
≥ 2 mm (0,2 millivolt [mV]) negli uomini o ≥ 1,5 mm (0,15 mV) nelle donne nelle derivazioni V2-V3;
≥ 1 mm (0,1 mV) in 2 altre derivazioni contigue toraciche o per arti.
nuovo o presumibilmente nuovo LBBBB, che viene considerato un equivalente di STEMI (ma la maggior parte dei casi di LBBBB al momento della diagnosi non sono noti per essere pregressi o di nuova insorgenza); i criteri ECG per la diagnosi di STEMI in uno scenario di LBBB includono uno qualsiasi fra i seguenti:
sopraslivellamento ST ≥ 1 mm (0,1 mV) e concorde al complesso QRS;
depressione ST ≥ 1 mm (0,1 mV) in V1, V2 o V3;
sopraslivellamento ST ≥ 5 mm (0,5 mV) e discordante con il complesso QRS;
La depressione ST in 2 o più derivazioni precordiali (V1-V4) può indicare una lesione transmurale posteriore;
ulteriori derivazioni toraciche posteriori (V7-V9) possono aiutare a identificare l’infarto miocardico posteriore isolato:
l’elevazione ST ≥ 0,5 mm (0,05 mV) (o ≥ 1 mm [0,1 mV] negli uomini < 40 anni) è coerente con l’infarto miocardico infero-basale;
spesso corrisponde all’occlusione del territorio circonflesso sinistro e si presenta con depressione ST isolata ≥ 0,05 mL nelle derivazioni V1-V3 su ECG a 12 derivazioni.
I risultati dell’ECG suggeriscono in generale un infarto miocardico non STEMI (NSTEMI) o un’angina instabile al posto dello STEMI:
Depressione ST
Inversione delle onde T
elevazione ST transitoria
ulteriori considerazioni per l’interpretazione dell’ECG:
i gruppi di lead (conduttori contigui) comprendono:
derivazioni laterali (derivazioni apicali) – I, aVL;
derivazioni supplementari:
V3R e V4R riflettono la parete libera del ventricolo destro;
i lead posteriori del torace riflettono la parete posteriore;
Le prime manifestazioni dell’ischemia miocardica possono comprendere:
aumento dell’ampiezza delle onde T iperacute;
onde T simmetriche prominenti e simmetriche in conduttori contigui;
onde Q transitorie;
l’ischemia miocardica acuta può anche essere presente con:
nuova depressione ST orizzontale o a discesa ≥ 0,5 mm (0,05 mV) in 2 derivazioni contigue;
T inversione T ≥ 1 mm (0,1 mV) in 2 lead contigui con onda R prominente o rapporto R/S > 1;
se l’ECG è equivoco o non mostra prove a sostegno del sospetto clinico di infarto miocardico, ripetere l’ECG e, se possibile, confrontare l’ultimo ECG con quello precedente;
Localizzazione dell’infarto all’ECG
Le coronarie sono due: la coronaria desra (Cdx) e la coronaria sinistra (Csx).
La prima porzione della coronaria sinistra prende il nome di tronco comune (TC) che si divide nel ramo discendente anteriore (IVA o LAD) e nel ramo circonflesso (Cx).
Dalla discendente anteriore si dipartono uno o due rami diagonali (D1, D2).
Dal ramo circonflesso originano uno o più rami per il margine ottuso (MO1, MO2, MO3).
Sia la coronaria destra che le diramazioni della sinistra (IVA e Cx) vengono suddivise in un tratto prossimale, medio e distale.
In particolare:
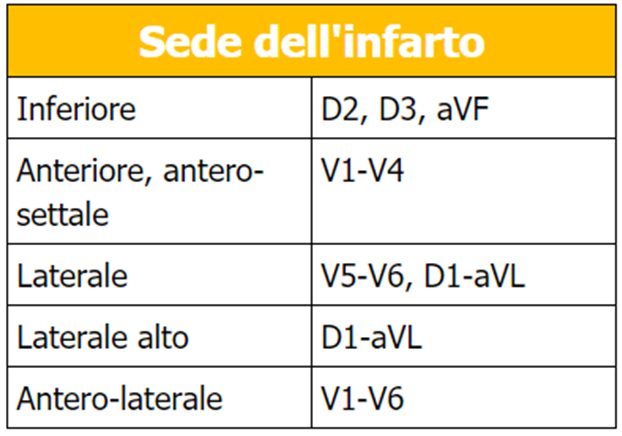
l’ostruzione della coronaria destra provocherà un Infarto inferiore le cui alterazioni elettrocardiografiche (sopraslivellamento del tratto ST) saranno visibili in D2, D3, aVF. Potrà essere associato, o meno, un infarto posteriore (sotto-slivellamento in V1-V2 con onda R pronunciata).
l’ostruzione della discendente anteriore determinerà un Infarto anteriore o antero-settale che sarà visibile in V1-V4.
l’ostruzione della circonflessa (Cx) determinerà un Infarto laterale o laterale alto (V5-V6, D1-aVL); a volte si può associare anche un interessamento inferiore e/o posteriore.
l’ostruzione del tronco comune della coronaria sinistra determinerà un infarto antero-laterale esteso (V1-V6, D1, aVL).
N.B. Queste definizioni non vanno considerate come assiomatiche poiché esiste una variabilità anatomica coronarica individuale molto ampia.
Immagine 04
Immagine 04. Sede dell’infarto.
Terapia
La gestione iniziale dovrebbe essere diretta a somministrare farmaci per ridurre l’ischemia miocardica, avviare una terapia anti-piastrinica e identificare una strategia di riperfusione che ripristini il flusso sanguigno all’arteria colpevole nel modo più rapido e sicuro possibile una volta che la diagnosi di STEMI è stata fatta per ridurre al minimo le lesioni del miocardio/infarto.
terapia medica iniziale:
morfina 4-8 mg IV inizialmente, poi 2-8 mg IV ogni 5-15 minuti in caso di dolore, ansia o edema polmonare (da usare con cautela nei pazienti con ipotensione).
l’aspirina 162-325 mg deve essere somministrata (masticata) non appena è presente il sospetto di STEMI, poi 81-325 mg una volta al giorno;
nitroglicerina:
dose tipica 0,4 mg per via sublinguale ogni 5 minuti (fino a 3 dosi) come necessario per alleviare il disagio dovuto all’ischemia;
la nitroglicerina per via endovenosa (a partire da 10 mcg/minuto, titolata alla pressione sanguigna) può essere usata per ischemia residua, ipertensione o insufficienza cardiaca;
utilizzare con cautela nei pazienti con pressione sanguigna sistolica < 90 mm Hg o > 30 mm Hg al di sotto della linea di base, bradicardia o tachicardia significativa, infarto ventricolare destro o uso di inibitore della fosfodiesterasi (per esempio, sildenafil [Viagra]) nelle ultime 24-48 ore;
l’ossigeno necessario per prevenire l’ipossiemia mantenendo la saturazione di O2 > 90%, tuttavia l’ossigenoterapia di routine non può ridurre la mortalità nei pazienti con infarto miocardico acuto
approccio alla terapia di riperfusione (intervento coronarico percutaneo, innesto di bypass coronarico o trombolisi):
intervento coronarico percutaneo primario (PCI):
raccomandato per lo STEMI se i sintomi durano da < di 12 ore e la procedura PCI può essere eseguita entro 90-120 minuti (ACCF/AHA Classe I, Livello A; ESC Classe I, Livello A) o indipendentemente dal ritardo di tempo se controindicazione alla terapia fibrinolitica (ACCF/AHA Classe I, Livello B);
consigliato in qualsiasi momento se STEMI e scompenso cardiaco acuto grave o shock cardiogeno (ACCF/AHA Classe I, Livello B).
se non è in grado di effettuare una PCI entro 120 minuti, la fibrinolisi è raccomandata in assenza di controindicazioni se la sintomatologia è insorta da meno di 12 ore (ACCF/AHA Classe I, Livello A; ESC Classe I, Livello A) e ragionevole se entro 12-24 ore e ischemia in corso (ACCF/AHA Classe IIa, Livello C);
innesto di bypass coronarico (CABG):
indicato per pazienti con STEMI e anatomia coronarica non suscettibili di PCI se ischemia in corso o ricorrente, shock cardiogeno, scompenso cardiaco grave o altre caratteristiche ad alto rischio (ACCF/AHA Classe I, Livello B; ESC Classe I, Livello B);
deve essere considerato nei pazienti con ischemia in corso e con un’ampia area del miocardio a rischio se non è possibile eseguire il PCI dell’arteria infartuale (Classe IIa ESC, Livello C).
PCI dopo fibrinolisi:
eseguire 2-24 ore dopo il successo della terapia fibrinolitica (ACCF/AHA Classe IIa, Livello B; ESC Classe I, Livello A);
eseguire se:
riperfusione fallita (< 50% di risoluzione del segmento ST dopo 60-90 minuti) (ACCF/AHA Classe IIa, Livello B; ESC Classe I, Livello A);
prove di riocclusione dopo una fibrinolisi iniziale riuscita (ACCF/AHA Classe IIa, Livello B; ESC Classe I, Livello B);
ischemia ricorrente (ACCF/AHA Classe I, Livello B; ESC Classe I, Livello B).
chirurgia rapida indicata per la maggior parte delle complicazioni meccaniche (come la rottura del muscolo cardiaco);
Immagine 05
Figura 05. Un’illustrazione tratta dalle ultime Linee Guida ESC sullo STEMI che riassume i suddetti percorsi. EMS: servizio di emergenza territoriale FMC: first medical contact inteso come diagnosi di ECG-grafica di STEMI.
farmaci antipiastrinici e anticoagulanti:
L’inibitore P2Y12 dovrebbe essere avviato in aggiunta all’aspirina:
clopidogrel (Plavix) 600 mg se con PCI primario (ACCF/AHA Classe I, Livello B) o 300 mg se ≤ 75 anni e trattato con terapia fibrinolitica (ACCF/AHA Classe I, Livello C), quindi 75 mg una volta al giorno; le linee guida europee raccomandano clopidogrel 600 mg se ticagrelor o prasugrel non disponibili o controindicati (ESC Classe I, Livello A).
alternative al clopidogrel associate a un ridotto rischio di morte e infarto del miocardio se si dispone di PCI:
prasugrel (Effient) 60 mg, poi 10 mg una volta al giorno (ACCF/AHA Classe I, Livello B; ESC Classe I, Livello B);
ticagrelor (Brilinta) 180 mg, poi 90 mg due volte al giorno (ACCF/AHA Classe I, Livello B; ESC Classe I, Livello B); le linee guida europee raccomandano il passaggio al ticagrelor, salvo controindicazioni, nei pazienti che hanno ricevuto in precedenza il clopidogrel, indipendentemente dai tempi o dalla dose di carico del clopidogrel (ESC Classe I, Livello B).
terapia anticoagulante raccomandata:
se si dispone di PCI: o eparina IV non frazionata (ACCF/AHA Classe I, Livello C) o bivalirudina IV (ACCF/AHA Classe I, Livello B); bivalirudina 0,75 mg/kg bolo IV, quindi, 1,75 mg/kg/ora di infusione associata a una riduzione del sanguinamento e della mortalità rispetto all’eparina non frazionata;
se trattata con fibrinolitici: eparina IV non frazionata (ACCF/AHA Classe I, Livello C), enoxaparina (ACCF/AHA Classe I, Livello A), o fondaparinux (ACCF/AHA Classe I, Livello B); l’enoxaparina e la fondaparinux riducono ciascuna il tasso di reinfarzione rispetto all’eparina non frazionata.
evitare i farmaci antinfiammatori non steroidei (tranne l’aspirina) durante il ricovero per STEMI.
terapia medica supplementare:
beta-bloccanti:
in pazienti che non hanno controindicazioni (come insufficienza cardiaca, ipotensione, bradicardia, blocco cardiaco, STEMI precipitati dall’uso di cocaina):
iniziare la terapia orale con beta-bloccanti (come il metoprololo tartrato 25-50 mg ogni 6 ore) nelle prime 24 ore (ACCF/AHA Classe I, Livello B); le linee guida europee raccomandano la terapia orale per i pazienti con STEMI con scompenso cardiaco e/o frazione di eiezione ventricolare sinistra (LVEF) ≤ 40% (ESC Classe I, Livello A);
i beta-bloccanti IV (come il metoprololo tartrato 5 mg IV ogni 5 minuti fino a 15 mg) sono ragionevoli se l’ischemia ipertensiva o in corso (ACCF/AHA Classe IIa, Livello B; ESC Classe IIa, Livello B).
i beta-bloccanti somministrati come trattamento immediato o a breve termine dopo un infarto miocardico acuto possono non diminuire la mortalità a breve termine, ma possono diminuire la mortalità a lungo termine.
inibitore dell’enzima di conversione dell’angiotensina (ACE):
ACE-inibitore entro le prime 24 ore dallo STEMI, a meno che non sia controindicato (shock, stenosi bilaterale dell’arteria renale, allergia ai farmaci):
riduce la mortalità;
raccomandato per pazienti con infarto anteriore, insufficienza cardiaca o LVEF < 40% (ACCF/AHA Classe I, Livello A; ESC Classe I, Livello A);
ragionevole per tutti i pazienti con STEMI (ACCF/AHA Classe IIa, Livello A; ESC Classe IIa, Livello A).
bloccante del recettore dell’angiotensina (ARB) raccomandato se indicazione per ACE inibitore ma ACE inibitore non tollerato (ACCF/AHA Classe I, Livello B; ESC Classe I, Livello B).
antagonisti dell’aldosterone raccomandati, a meno che non siano controindicati per i pazienti con STEMI, LVEF < 40%, insufficienza cardiaca sintomatica o diabete mellito, e che già ricevono ACE inibitore e beta-bloccante (ACCF/AHA Classe I, Livello B; ESC Classe I, Livello B);
statina (come l’atorvastatina 80 mg una volta al giorno) raccomandata per tutti i pazienti con STEMI e senza controindicazioni (ACCF/AHA Classe I, Livello B; ESC Classe I, Livello A); uso di statina entro le prime 24 ore associato a una minore mortalità in ospedale e a meno complicazioni precoci;
un controllo rigoroso del glucosio non è raccomandato durante lo STEMI, ma è ragionevole mantenere i livelli di glucosio < 180 mg/dL evitando l’ipoglicemia (ESC Classe IIa, Livello C).